In the first part of IELTS Academic Writing, you can come across different types of graphs: a line or bar graph, a table, a map, a process, two graphs or two tables.

In the first part of IELTS Academic Writing, you can come across different types of graphs: a line or bar graph, a table, a map, a process, two graphs or two tables.
You select words and grammatical constructions depending on the type of graph you are writing about. For example, if you got a process (e.g. water cycle on Earth) you use words such as: first, following this, the next stage, then ... etc. For a table, such words are not the best idea.
1. Bar Chart
You should spend about 20 minutes on this task.
The bar chart shows the global sales (in billions of dollars) of different types of digital games between 2000 and 2006.
Summarise the information by selecting and reporting the main features, and make
comparisons where relevant.
Write at least 150 words.
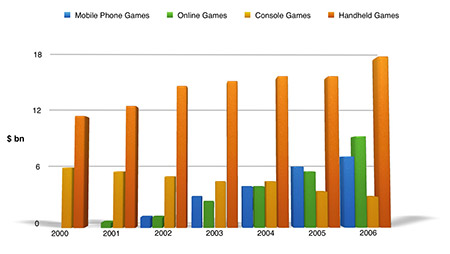
In the task, only the part in bold changes.
2. Table
The table below shows the proportion of different categories of families living in poverty in Australia in 1999.
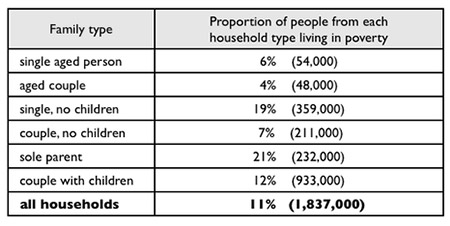
There may be two tables:

The description of tables is very similar to the description of graphs. We use the same language of comparison and contrast. The table can be easily turned into a bar chart, but the information is better presented with the table: we immediately see the similarities and differences.
We should try to group this information. For example, in case where there are several different countries, they can be combined as developed and developing countries. So, you do not have to write about each country separately.
3. Line Graph
The graph below shows the average number of UK commuters travelling each day by car, bus or train between 1970 and 2030.

4. Pie Chart
The pie charts compare the expenditure of a school in the UK in three different years over a 20-year period.
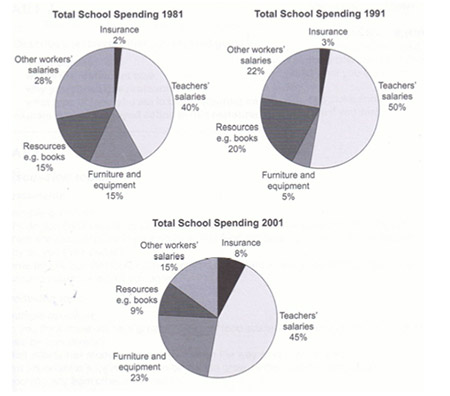
We structure the answer as follows:
Firstly, we write about the largest parts (40%, 50%, 45%), then we cover those that are slightly smaller (28%, 22%, 23%), etc. 8% and 9% - can be combined.
We do not write about each chart separately. We take one category in the first graph and compare it with other graphs - what is the same and what is different.
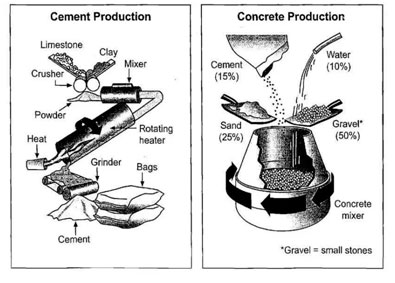
5. Process
Sometimes there could be a description of a process OR a life cycle of an animal or insect; and you must be prepared for this. The structure is similar to the rest of the tasks:
- Introduction (rephrase the assignment)
- The main part (Here we write about the stages / steps of the process and use the passive voice (e.g. water is evaporated)
- Conclusion (give an overview, i.e. something in common about the process).
For example, how many stages there are, or how the process begins and ends:
Overall, there are eight stages in the process, beginning with the digging up of clay and culminating in delivery.
Process example

Life cycle

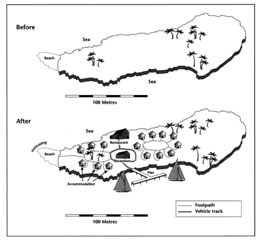
6. Maps
In the latest tests people have been coming across tasks with 2 maps.
The examiners say that the maps description answers are weaker than the graphs description because, apparently, everyone is diligently preparing for the graphs and ignoring maps: “Since there is a small chance that I come across map description, It is not necessary to prepare for it”. It is necessary)
Here in the main part we write about the main changes that have occurred: what was built + where. You can add why it was built. To add more details, you can write about what was / wasn’t there before.
Maps Examples

7. Two Graphs (2 tables, a chart and a table or 3 pie charts)
The graph and table below give information about water use worldwide and water consumption in two different countries.
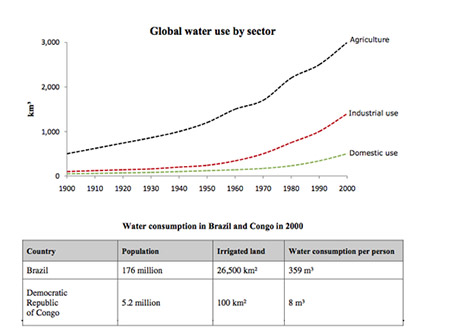

With this one it is very important to choose the information about which one you are going to write. You don’t need to write about everything! You can choose the most basic information. After you rephrase the assignment in the introduction, you can write about the first chart. In the next paragraph, you can write about the second. This way you will not get confused, and it will be easy for the examiner to read your answer. In conclusion, you can show how the two graphs are connected.
How to master IELTS Writing: Task 1 & Task 2
14 lessons / 7+ hours of video content
- How to write an answer to ANY type of Essay task
- How to write an answer to ANY type of Graph task
- How to structure your answer
- What to write in each paragraph
- What grammar to use
- How to link your ideas
- What vocabulary to use
- What you should write to get a high score